
There are many ways to customize trading performance to suit your criteria. You can rank trading systems by total return, live performance, drawdown, profit factor, and the list of possibilities go on and on.
We will do a quick analysis of the top algorithmic trading systems based on two criteria:
- TM Score: the TM score (which rates a system according to worst drawdown, return, and length of track record) must be a 3 out of 3, constituting the highest possible TM rating.
- Live Performance: the system must have a minimum of 6 months of continuous live trading, and the live results must be positive overall.
Sifting through over 1,000 trading programs on iSystems, the results we came up with are listed below.
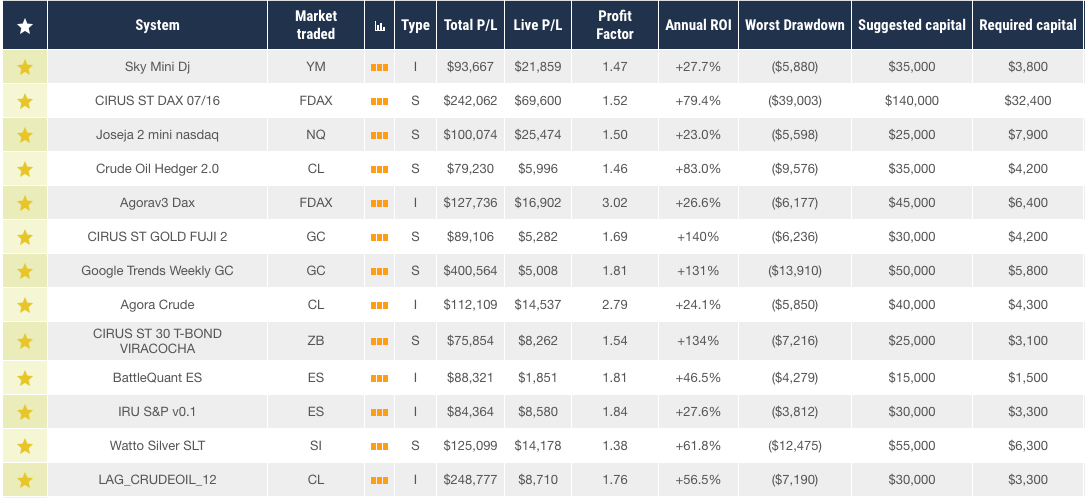
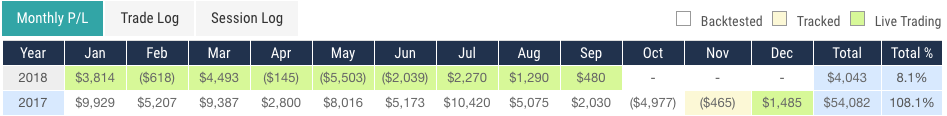
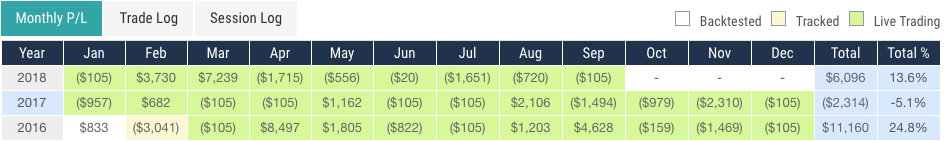
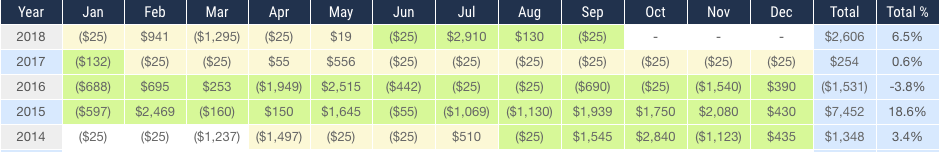
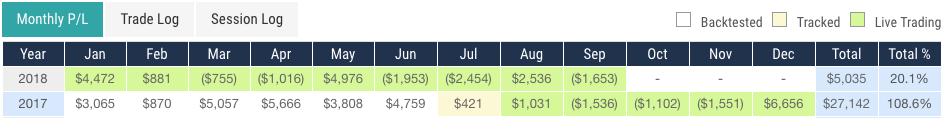
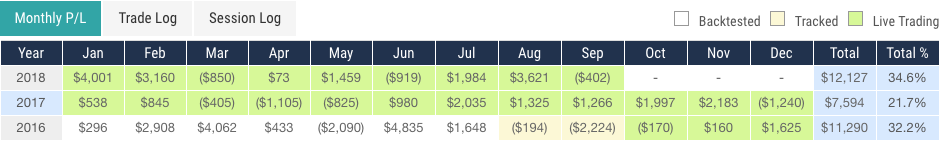
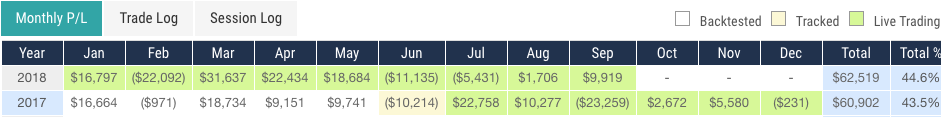
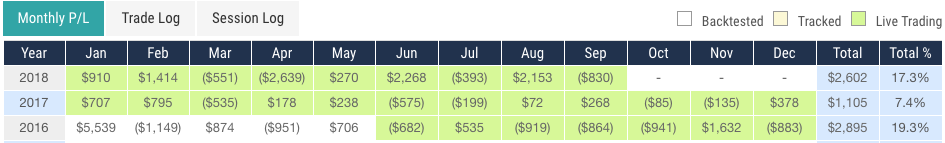
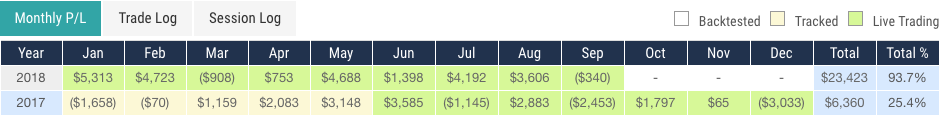
Click on the symbols to view entire performance data. Below each symbol, we are providing the row that illustrates a system’s performance for the years it had traded live. Live performance data is highlighted in green.


If you are interested in learning more about any of these systems, contact one of our representatives at Halifax America by sending us an email at info@halifaxamerica.com.
IMPORTANT RISK DISCLOSURE
Futures trading is complex and carries the risk of substantial losses. It is not suitable for all investors. The ability to withstand losses and to adhere to a particular trading program in spite of trading losses are material points which can adversely affect investor returns.
The returns for trading systems listed throughout this website are hypothetical in that they represent returns in a model account. The model account rises or falls by the average single contract profit and loss achieved by clients trading actual money pursuant to the listed system’s trading signals on the appropriate dates (client fills), or if no actual client profit or loss available – by the hypothetical single contract profit and loss of trades generated by the system’s trading signals on that day in real time (real-time) less slippage, or if no real time profit or loss available – by the hypothetical single contract profit and loss of trades generated by running the system logic backwards on backadjusted data (backadjusted).
Note that the Client Fill Trades are reported across all clients utilizing the platform, across multiple brokers, and are not based solely on the performance of accounts at this brokerage.
The hypothetical model account begins with the initial capital level listed, and is reset to that amount each month. The percentage returns reflect inclusion of commissions, fees, slippage, and the cost of the system. The monthly cost of the system is subtracted from the net profit/loss prior to calculating the percentage return.
If and when a trading system has an open trade, the returns are marked to market on a daily basis, using the backadjusted data available on the day the computer backtest was performed for backtested trades, and the closing price of the then front month contract for real time and client fill trades. For a trade which spans months, therefore, the gain or loss for the month ending with an open trade is the marked to market gain or loss (the month end price minus the entry price, and vice versa for short trades).
The actual percentage gains/losses experienced by investors will vary depending on many factors, including, but not limited to: starting account balances, market behavior, the duration and extent of investor’s participation (whether or not all signals are taken) in the specified system and money management techniques. Because of this, actual percentage gains/losses experienced by investors may be materially different than the percentage gains/losses as presented on this website.
Please read carefully the CFTC required disclaimer regarding hypothetical results below. HYPOTHETICAL PERFORMANCE RESULTS HAVE MANY INHERENT LIMITATIONS, SOME OF WHICH ARE DESCRIBED BELOW. NO REPRESENTATION IS BEING MADE THAT ANY ACCOUNT WILL OR IS LIKELY TO ACHIEVE PROFITS OR LOSSES SIMILAR TO THOSE SHOWN; IN FACT, THERE ARE FREQUENTLY SHARP DIFFERENCES BETWEEN HYPOTHETICAL PERFORMANCE RESULTS AND THE ACTUAL RESULTS SUBSEQUENTLY ACHIEVED BY ANY PARTICULAR TRADING PROGRAM. ONE OF THE LIMITATIONS OF HYPOTHETICAL PERFORMANCE RESULTS IS THAT THEY ARE GENERALLY PREPARED WITH THE BENEFIT OF HINDSIGHT. IN ADDITION, HYPOTHETICAL TRADING DOES NOT INVOLVE FINANCIAL RISK, AND NO HYPOTHETICAL TRADING RECORD CAN COMPLETELY ACCOUNT FOR THE IMPACT OF FINANCIAL RISK OF ACTUAL TRADING. FOR EXAMPLE, THE ABILITY TO WITHSTAND LOSSES OR TO ADHERE TO A PARTICULAR TRADING PROGRAM IN SPITE OF TRADING LOSSES ARE MATERIAL POINTS WHICH CAN ALSO ADVERSELY AFFECT ACTUAL TRADING RESULTS. THERE ARE NUMEROUS OTHER FACTORS RELATED TO THE MARKETS IN GENERAL OR TO THE IMPLEMENTATION OF ANY SPECIFIC TRADING PROGRAM WHICH CANNOT BE FULLY ACCOUNTED FOR IN THE PREPARATION OF HYPOTHETICAL PERFORMANCE RESULTS AND ALL WHICH CAN ADVERSELY AFFECT ACTUAL TRADING RESULTS.
The information contained in the reports within this site is provided with the objective of “standarizing” trading systems account performance and is intended for informational purposes only. It should not be viewed as a solicitation for the referenced system or vendor. While the information and statistics within this website are believed to be complete and accurate, we cannot guarantee their completeness or accuracy. As past performance does not guarantee future results, these results may have no bearing on, and may not be indicative of, any individual returns realized through participation in this or any other investment.
The statistics on this page are calculated via the combination of three hypothetical data sets:
- Backtested, 2. Tracked, and where available 3. Live.
Backtested performance is calculated by running a trading system backwards in time, and seeing what trades would have been done in the past when applied to backadjusted data. Tracked performance is calculated by running the trading system forwards on data each and every day, and logging the trades as they happen in real time day after day. Live performance is calculated by running the trading system on live tick data for actual clients and tracking the actual buy and sell prices those clients trading the system receive in their account.
We use Live results to calculate monthly returns for any month in which clients were trading for the entire month, Tracked fills for those months in which there are no client fills for the entire month, and computer generated fills for those months occurring before we loaded the system onto our trade servers. The results are hypothetical in that they represent returns in a model account. The model account rises or falls by the single contract profit and loss achieved by the system in whichever data set is available. The hypothetical model account begins with the Sugested Capital listed, and is reset to that amount each month. The percentage returns reflect inclusion of commissions, fees, slippage, and the cost of the system. The commission, slippage, fees, and monthly system costs are subtracted from the net profit/loss prior to calculating the percentage return.
Please note that the method of resetting the model account to the initial value at the start of each month creates a track record which is representative of the simple returns for each time period, but that it does not, by definition, show how returns would compound over time. Should an investor following said program trade a single contract indefinitely without also resetting their account to the initial capital amount each month, their performance will differ from the performance detailed herein.
Recent Comments